


🩸 RedBloodJournal.com 🩸
#1360
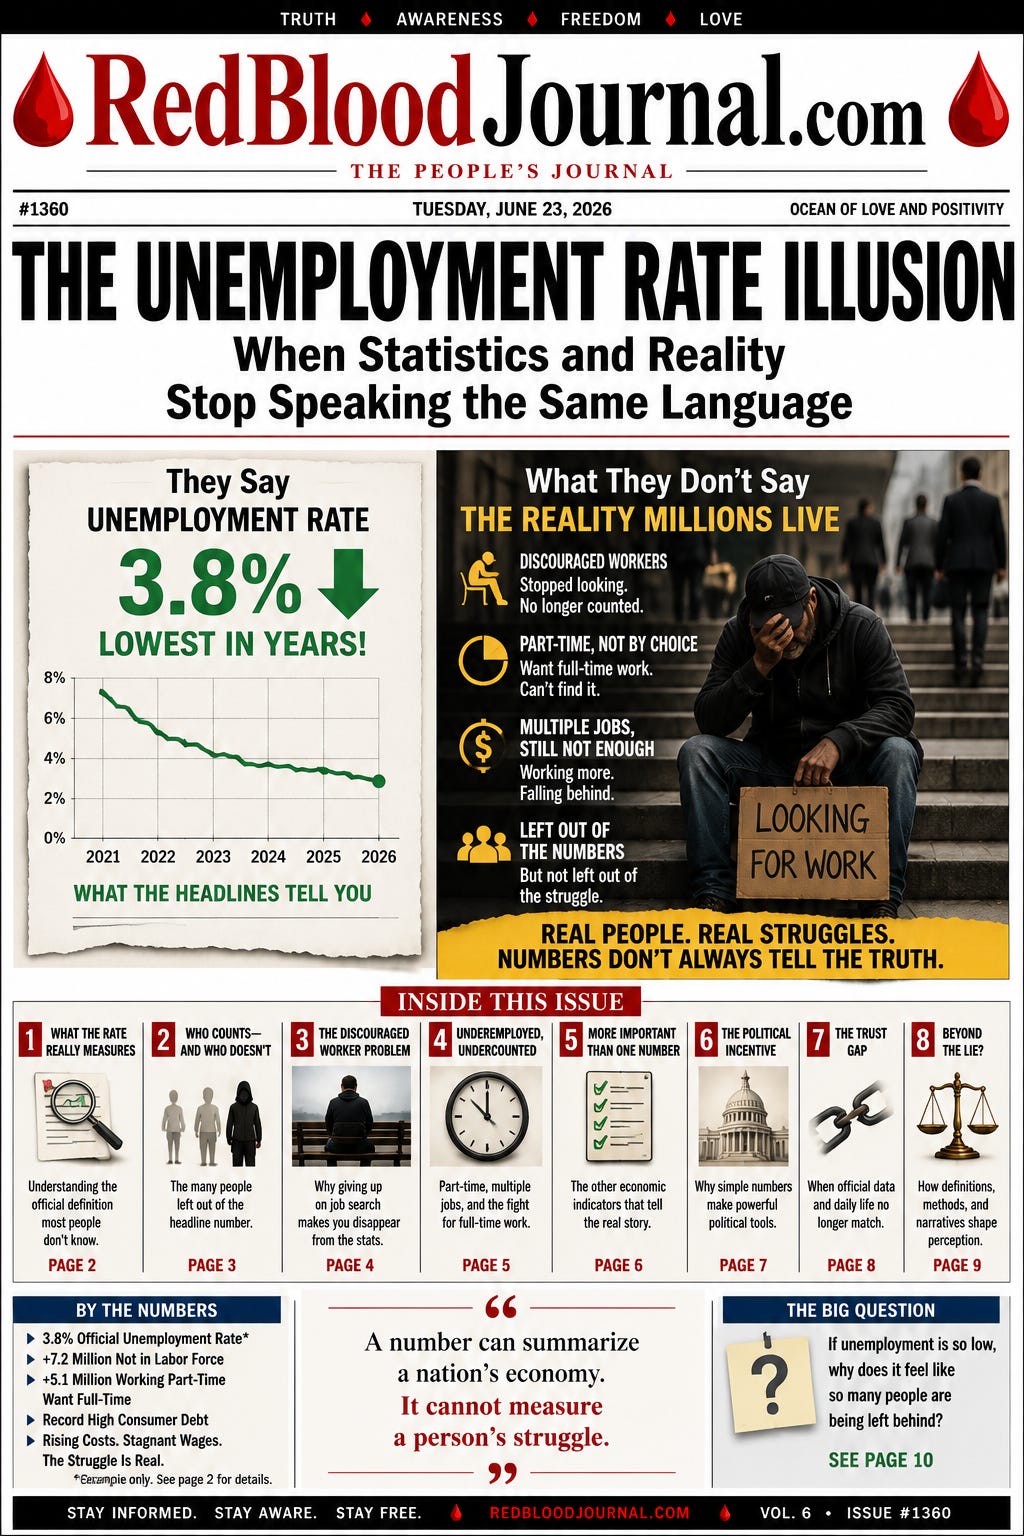
The Unemployment Rate Illusion
When Statistics and Reality Stop Speaking the Same Language
Date: June 23, 2026
Introduction
Few numbers receive more attention from politicians, economists, financial markets, and the media than the unemployment rate.
When the number falls, headlines celebrate.
When the number rises, concerns emerge.
Presidents cite it.
Governments promote it.
Markets react to it.
Yet many citizens look around their communities and ask a simple question:
If unemployment is so low, why does it feel like so many people are struggling?
This question has fueled growing skepticism toward official economic statistics.
The issue is not necessarily whether the unemployment rate is calculated incorrectly.
The issue is whether the headline number tells the complete story.
Part I: What Most People Think the Unemployment Rate Means
Ask the average person what the unemployment rate measures and the answer is usually straightforward.
People assume it means:
The percentage of people who do not have jobs.
That sounds logical.
Unfortunately, that is not how the most commonly reported unemployment rate is calculated.
Many people discover this only after examining the methodology.
When they do, they often begin questioning the narrative built around the number.
Part II: Who Counts and Who Does Not
Under the most widely reported unemployment measure, a person generally counts as unemployed only if:
They do not have a job.
They are available to work.
They have actively searched for work recently.
This creates an important distinction.
A person who wants work but has stopped searching may no longer be counted as unemployed.
A discouraged worker who believes no jobs are available may disappear from the headline figure.
The individual remains unemployed in everyday language.
Yet statistically, they may no longer be part of the unemployment rate.
For many citizens, this is the moment trust begins to weaken.
Part III: The Discouraged Worker Problem
Imagine two individuals.
The first loses a job and submits applications every day.
The second loses a job but eventually becomes discouraged after months of rejection.
Both remain without employment.
Yet depending on the methodology used, one may continue appearing in unemployment statistics while the other may not.
To critics, this creates a troubling perception.
The unemployment rate can improve without a single new job being created if enough people stop looking.
Whether this interpretation is fair or not, it highlights why methodology matters.
Definitions shape outcomes.
Outcomes shape narratives.
Narratives shape public perception.
Part IV: Part-Time Employment and Economic Reality
Another criticism involves underemployment.
Many workers hold part-time positions while seeking full-time employment.
Others work multiple jobs simply to maintain basic living standards.
Official employment statistics may classify these individuals as employed.
Technically, this is correct.
Yet many citizens question whether a person working a few hours per week while searching desperately for full-time work truly reflects economic health.
The difference between employment and economic security can be substantial.
Part V: The Number Behind the Number
The unemployment rate often becomes a political talking point because it appears simple.
A single percentage is easy to communicate.
A single percentage is easy to place in headlines.
A single percentage is easy to compare across administrations.
Reality, however, is more complicated.
A meaningful picture of economic health may require examining:
Labor force participation.
Wage growth.
Housing affordability.
Consumer debt.
Inflation.
Purchasing power.
Full-time versus part-time employment.
Workforce participation among working-age adults.
Viewed together, these indicators often tell a different story than any single statistic.
Part VI: Why Governments Prefer Simple Numbers
Governments naturally seek metrics that can be communicated clearly.
Complex economic realities do not fit easily into headlines.
A falling unemployment rate is easy to present.
Explaining workforce participation trends, discouraged workers, and underemployment is far more difficult.
Critics argue that this creates incentives to emphasize favorable indicators while minimizing less favorable ones.
Supporters respond that standardized measurements are necessary for consistency and historical comparison.
The disagreement is not merely about mathematics.
It is about presentation.
Part VII: The Trust Gap
The greatest danger may not be statistical methodology itself.
The greatest danger is the growing gap between official statistics and personal experience.
Citizens may hear:
“The economy is strong.”
Yet experience:
Higher rent.
Higher insurance.
Higher healthcare costs.
Higher food prices.
Greater financial stress.
When official messaging and daily life appear disconnected, trust begins to erode.
The public may not understand every economic formula.
But individuals understand their own household budgets.
That reality often carries greater weight than government reports.
Part VIII: The Political Incentive
Every government faces pressure to demonstrate success.
Strong employment numbers help build confidence.
Weak employment numbers create political challenges.
This does not automatically mean statistics are fabricated.
However, critics argue that political systems naturally gravitate toward presenting the most favorable interpretation available.
The result can be a situation where statistics remain technically accurate while still failing to reflect the full reality experienced by many citizens.
In such cases, the debate shifts from truth versus falsehood to completeness versus omission.
Part IX: Beyond Unemployment
The unemployment rate is only one example of a larger phenomenon.
Citizens increasingly question:
Inflation measurements.
Poverty calculations.
Economic growth statistics.
Crime reporting methods.
Public health metrics.
The common concern is not always that numbers are invented.
The concern is that definitions can shape perception.
What is counted matters.
What is excluded matters.
How results are presented matters.
Conclusion
The unemployment rate remains one of the most cited economic indicators in the modern world.
Yet understanding its limitations is essential.
The headline number does not necessarily capture discouraged workers.
It does not fully capture underemployment.
It does not measure financial security.
It does not reveal whether wages keep pace with the cost of living.
Most importantly, it does not automatically reflect the lived experience of millions of citizens.
An informed observer looks beyond a single statistic.
The question is not merely:
“What is the unemployment rate?”
The deeper question is:
“What does the unemployment rate leave out?”
The answer to that question may reveal more about the economy than the headline itself.
Ocean of Love and Positivity
Numbers are useful tools.
But wisdom requires looking beyond numbers alone.
Statistics can describe a society.
They cannot fully describe the human experience within that society.
The Ocean of Love and Positivity encourages individuals to observe carefully, think independently, and compare official narratives with direct experience.
Truth often reveals itself not through a single number, but through a broader understanding of the whole picture.
A clear mind neither blindly accepts nor blindly rejects.
It observes, questions, and continues learning.
That is where genuine understanding begins.
🧐 The Unemployment Rate Illusion:
Beyond the Headline Statistic
Jun 23, 2026
This article examines why the official unemployment rate often fails to reflect the genuine financial struggles of the public.
It argues that the metric is misleading because it excludes discouraged workers who have stopped looking for jobs and ignores the difficulties of those who are underemployed in part-time roles.
The author suggests that governments prioritize this simplified statistic for political gain, even as citizens face rising costs and economic instability.
Ultimately, the text warns that a growing trust gap emerges when government reports contradict the lived experiences of the population.
To truly understand economic health, one must look past headline percentages and consider broader factors like purchasing power and workforce participation.
